

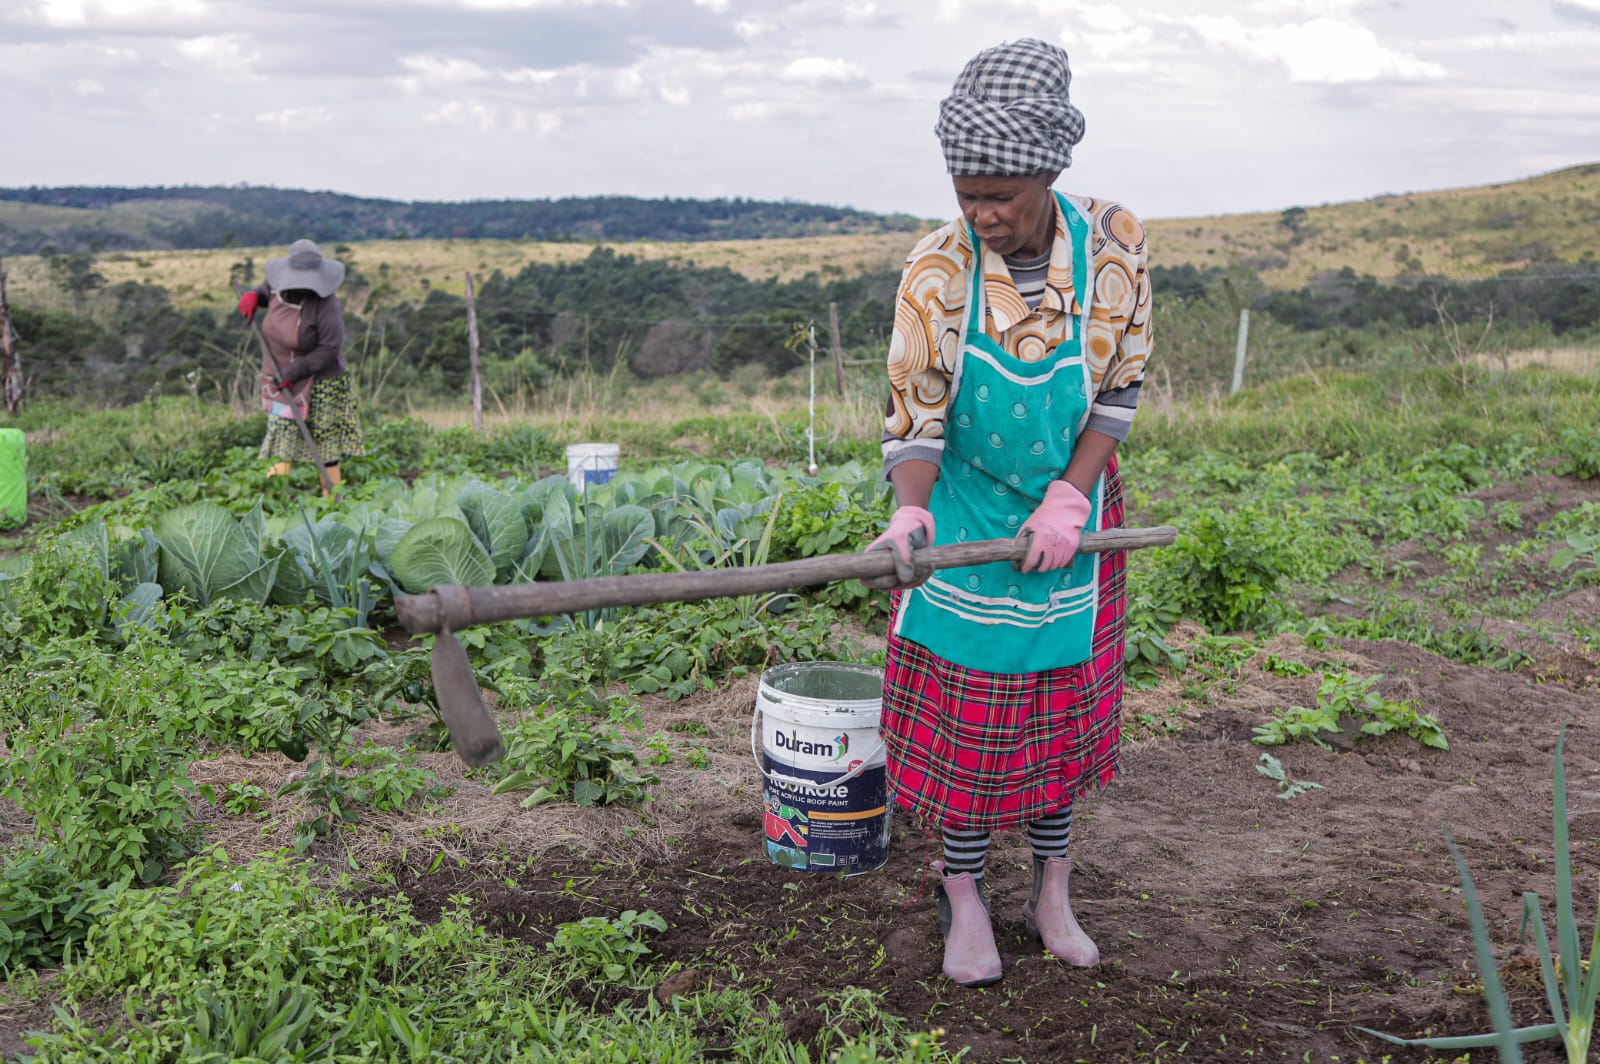
Most organic farmers don’t need a test to know when soil is improving; they see it in the crops, feel it in the ground they walk on every day. What’s harder is building a record that shows that progress over time. That was the question behind a 45-day monitoring period at Riverbend Farming Enterprises (RFE), an organic and agroecological grower in the Eastern Cape. Using the MBS SmartFarm platform, we monitored soil conditions across two vegetable gardens from 1 July to 14 August 2026. The results are worth sharing; both for individual farmers and for how continuous data could support record-keeping and participatory assurance systems like the South African Organic Sector Organisation‘s (SAOSO) Participatory Guarantee System (PGS).
A snapshot is useful. A track record can be more useful.
A soil test gives you a snapshot at one point in time. Continuous monitoring answers a different question: what was happening between those snapshots? RFE’s combined soil score started at 65 (Stage 3), moved into the Stage 5 range within three weeks, and held there for four consecutive weeks. The significance isn’t that one score improved; it’s that the improvement was observed repeatedly, building a pattern rather than relying on a single good day.
This isn’t a lab test or certification result. It’s a consistent way to track soil condition between farm visits, using directly sensed pH, EC and moisture – with some underlying indicators modelled from literature-based thresholds rather than measured directly, which is worth knowing when reading the number.
What the soil was telling us about water
RFE's soil-water retention indicator rose from 55 in early July to a peak of 85 by month's end, the kind of outcome agroecological practice aims for: soil that makes better use of the water it already receives.
Watering at RFE is entirely manual, a hose and watering cans from a JoJo tank, with no automated irrigation system. Across the full 45 days, the team watered by hand only twice. Most of the observed soil-moisture responses coincided with recorded rainfall events, including over 60 mm across 28-29 July – with the soil response verified at the monitored root zone rather than inferred from a nearby weather station.
One farm can have more than one story
RFE’s two gardens were tracked separately, and that mattered. By early August, Field Garden’s moisture had risen above 50% with salinity moving into an elevated range – worth continued observation, not an adverse finding. Demo Garden’s salinity, meanwhile, was trending the opposite way. Blended into one farm-wide average, that difference would have disappeared behind a number that looked fine overall. Tracked separately, it stays visible.
From farm records to a living record
This is where it connects to SAOSO and PGS. RFE’s PGS participation relies on farmer records, peer review and site assessment; continuous monitoring doesn’t replace any of that. What it can add is a record of what was happening between visits: supporting evidence alongside a farmer’s own records, and for a PGS community, a possible evidence layer alongside the trust and participatory review that make PGS what it is.
What 45 days can, and can’t tell us
This was one monitoring cycle, at one farm, during winter. It doesn’t establish seasonal or long-term outcomes, and the improvement can’t be pinned on any single practice or event. But it shows something practical: when continuous monitoring sits alongside already-good farming practice, patterns that normally stay invisible between farm visits start to become visible – turning “is the soil healthy today?” into “how has it been changing, and what can we learn from that?”
Read the RFE 45-Day Findings
Download the 2-page External Summary → LINK
Need the full technical report? A detailed 10-page version – including methodology, limitations and per-garden data, is available on request.
Contact MyBitSecure to request the full report → contact@mybitsecure.com

