

Green on your dashboard doesn’t always mean safe, and I’ve seen enough farmers stare at a green reading and relax too early to want to walk through this properly. The MBS SmartFarm Ecological Impact Index, the EII score you see on your dashboard, is built from four sensor readings, and knowing what those four are actually doing changes how you read your own numbers.
Moisture, EC, soil temperature, and pH. That’s it, those are the four. Moisture sits best between 20 and 35 percent for loam soil, that’s the water actually available to the roots. EC, electrical conductivity, sits best between 0.8 and 2.0 dS/m, and it’s basically a proxy for how much dissolved salt and nutrient is in the soil. Soil temperature between 15 and 25°C, which is what your roots and microbes need to actually be active. And pH between 6.0 and 7.0, which decides whether the nutrients that are there can even get absorbed.
Here’s the part that surprises people: not every reading inside the “good” range is equally good. Take a reading of 27.5% moisture, 1.4 dS/m EC, temp 20°C, and 6.6 pH. Every one of those is dead center in its band, not just barely passing. And that matters more than it sounds like it should, because a reading sitting near the edge of the good range has no room to move. A reading sitting in the middle has room on both sides before it slides into trouble.
Say your EC creeps up to 1.95 dS/m. Still technically “good,” still shows green on the dashboard. But one heavy fertilizer application, one rain event that changes the dilution, and you’re over the line into “elevated” before you’ve noticed anything’s wrong. Compare that to an EC sitting at 1.4, right in the middle, which can absorb that same event and stay fine. The buffer is the whole point. A number that only tells you pass or fail hides the one thing that actually matters, whether today’s good reading survives until tomorrow’s.
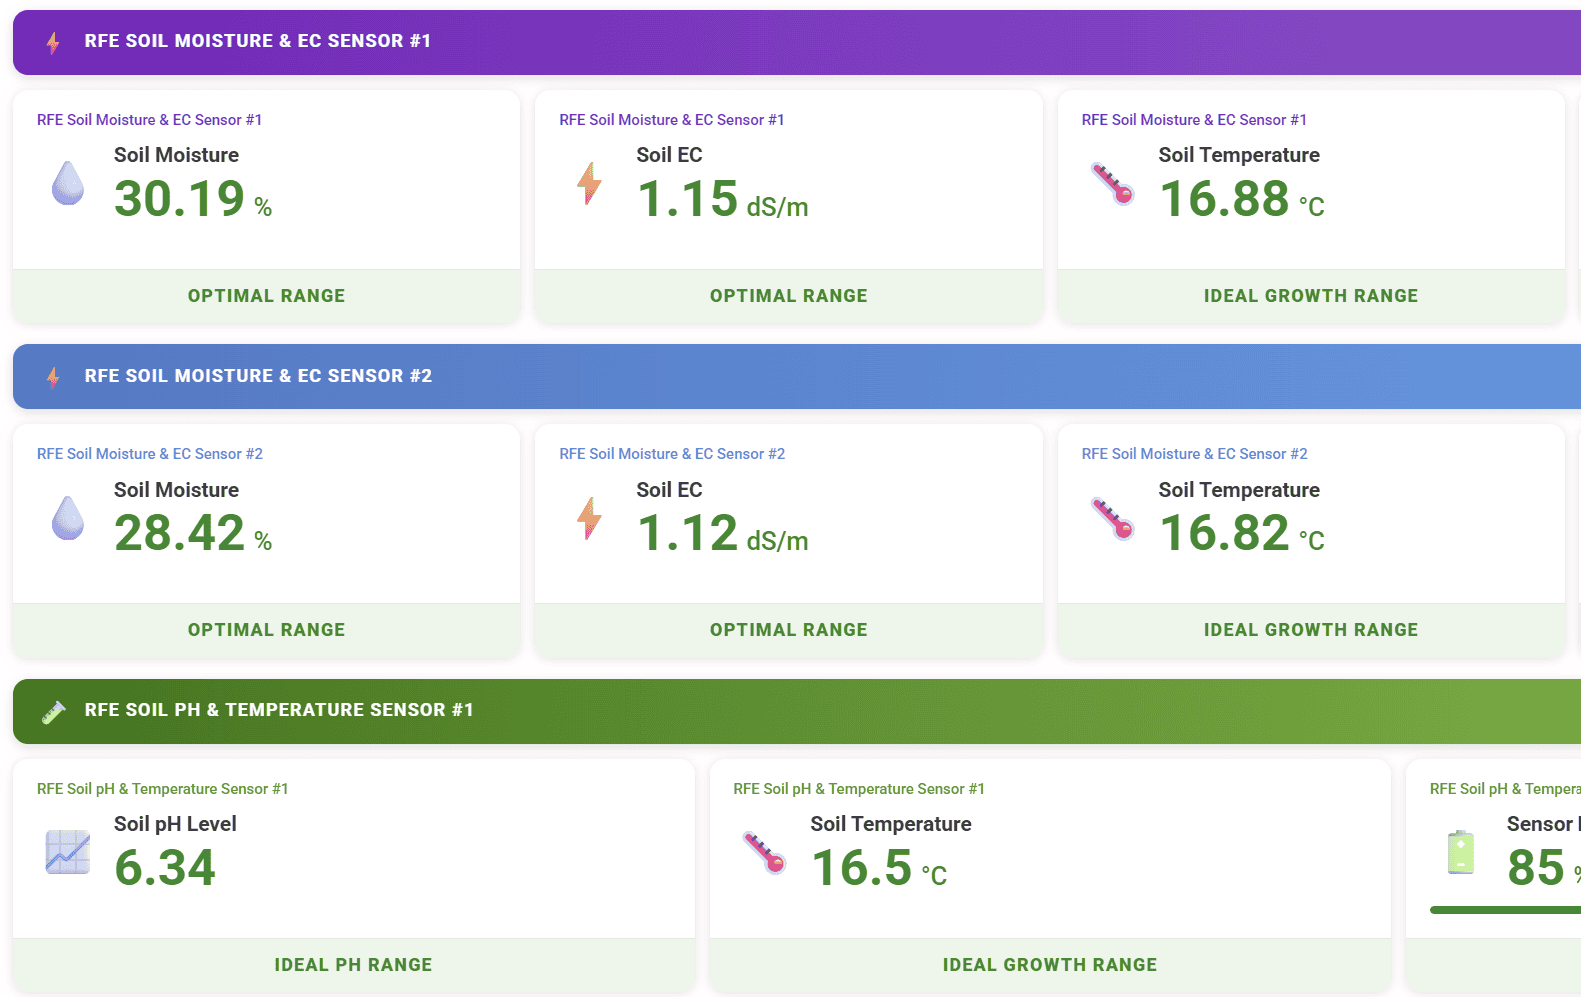
Take the Riverbend Farming Enterprises (RFE) example on our MBS SmartFarm dashboard, a real deployment. It scored 93, which is Stage 5, “Thriving,” off a pH of 6.34, EC of 1.15, temp 16.88°C and 30.19% average moisture. All three sit comfortably in the good range. But the score is 93, not 100. That gap tells you something: hitting the right numbers on moisture, EC, and pH is necessary, but it isn’t the whole picture, and Part 2 of this series gets into exactly why.
Can you push your farm’s numbers toward that same reading set on purpose? Yes, and it’s not even that hard once you know what you’re doing. Mulch and irrigation timing move moisture. Controlled fertigation moves EC. Shade cloth or a greenhouse moves temperature. Amendment moves pH. You’re deliberately tuning four things toward a known-good range.
If you only remember one number from this piece, make it EC. It’s the one that moves fastest under pressure, because fertilizer changes it directly and quickly in a way moisture and temperature just don’t respond to from a single input. Everyone knows the safe range, and the temptation to push past it chasing faster growth never really goes away. Treat EC as your tightest-tolerance reading, not pH or moisture, even though those two get more attention because they’re easier to explain.
Here’s what these four numbers won’t tell you on their own: they describe conditions that are favorable for biology. They don’t confirm biology is actually there, active, and holding itself together. You could, in theory, run a sterile hydroponic setup that reports these exact same four numbers all day long and never have a single earthworm, fungal network, or nitrogen-fixing bacterium in it. Good abiotic numbers are a precondition. They’re not the ecology itself.
Next time we’ll get into the biology side of the score, beneficial bacteria, mycorrhizal fungi, saprophytic fungi, earthworms, and why hitting all four numbers above doesn’t guarantee any of them are actually present in your soil. Want to see what your own field’s numbers actually look like instead of a reference example? Get a SmartFarm Quote and we’ll get sensors reading your own ground.

